Tableau boasts ease-of-use as a differentiator from other competitors in visual analytics. Our customers are truly captivated as they drags and drops the data into the visualization, see data, and discover insights. In this project, we strived to deliver the same kind of experience when they connect to the JSON data.
Tools
- Sketch for wireframe and visual design
- Tableau Desktop to prototype the experience
- R/R Studio to wrangle JSON Data
- MongoDB to review the dataset
Role
- Gather requirements
- Create user flow and wireframe
- Produce redline visual design for final delivery
- Perform usability studies
- Educate the team on Tableau to help building an integrated solution
Challenge #1
Unwinding complex technical concepts into common user scenarios.
The large part of the UX designers' job is about identifying problems, understanding use context, and then effectively communicating them to the team and stakeholders. A good user scenario describes user experience where users achieve their task goals, while users going through their own natural process in the product. The scenario also has to illicit the problem statements and spark the ideas and discussion among the team members.
The difficulty with this project was that there is a large gap between the concept of the semi-structured data and target users of Tableau. While the semi-structured data and its use cases are highly technical, the target users of Tableau are business analysts who do not necessarily understand that. I had the task to translate the technical world of semi-structured datasets into the user scenarios, where Tableau users would try to access the data and start analyzing it.
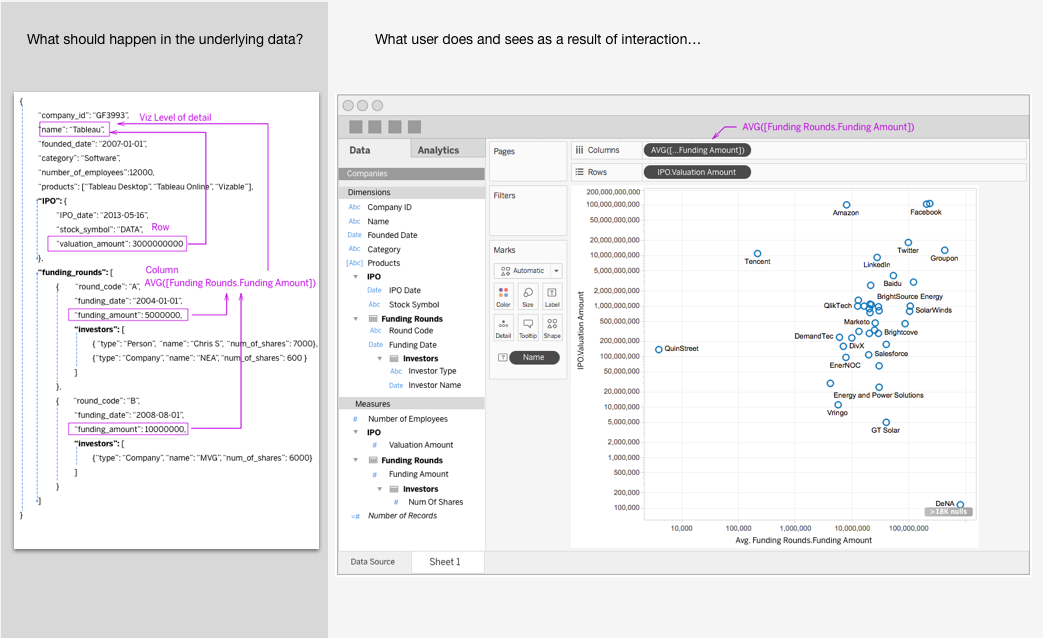
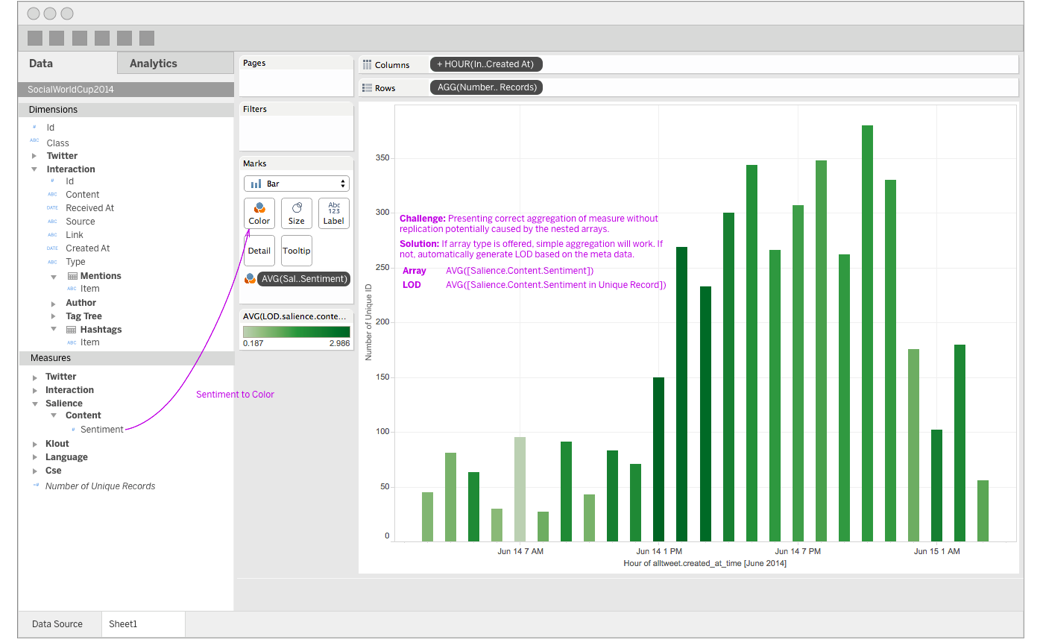
After many iterations of going through real-world datasets, analyzing them by myself, and talking to many experts in the company, I focused on a user scenario where a user answers their analytic questions without worrying about the underlying data structure, while hinting at what should be happening under the hood to support such a process.
The result from this process was that the team and the leadership understood the problem and also recognized that it has to do with fundamental challenges of Tableau itself, which sparked many creative solutions and discussions.
Challenge #2
A solution that any Tableau users can use.
After getting everyone on the same page with the user scenario, it is time to come up with a solution.
Tableau users may not necessarily understand what the JSON data looks like, let alone concept of semi-structured data model. Meanwhile, they may happened to have the data in JSON format because that is given from their fellow engineers or downloaded through web API. Given this consideration, the main goal is for any Tableau users to be able to load this data without worrying about the underlying data structure. Since Tableau reads and infer the structure, we can do a lot of smart things for users, instead of leaving them up to them.
The first obstacle achieving this goal was that actually convincing engineering that this feature is necessary. Many other data formats do not have such an intelligence and we were building something that did not have precedents. To validate whether this was necessary, we had a prototype that follows conventional flow of loading data and tested it with an expert user. The result was the user who knew ins-and-out of the Tableau, was not able to produce visualization that he was confident with. With that finding, the team was fully engaged to deliver the smart feature that allowed the users simply load the data and use it to visualize it.
Result
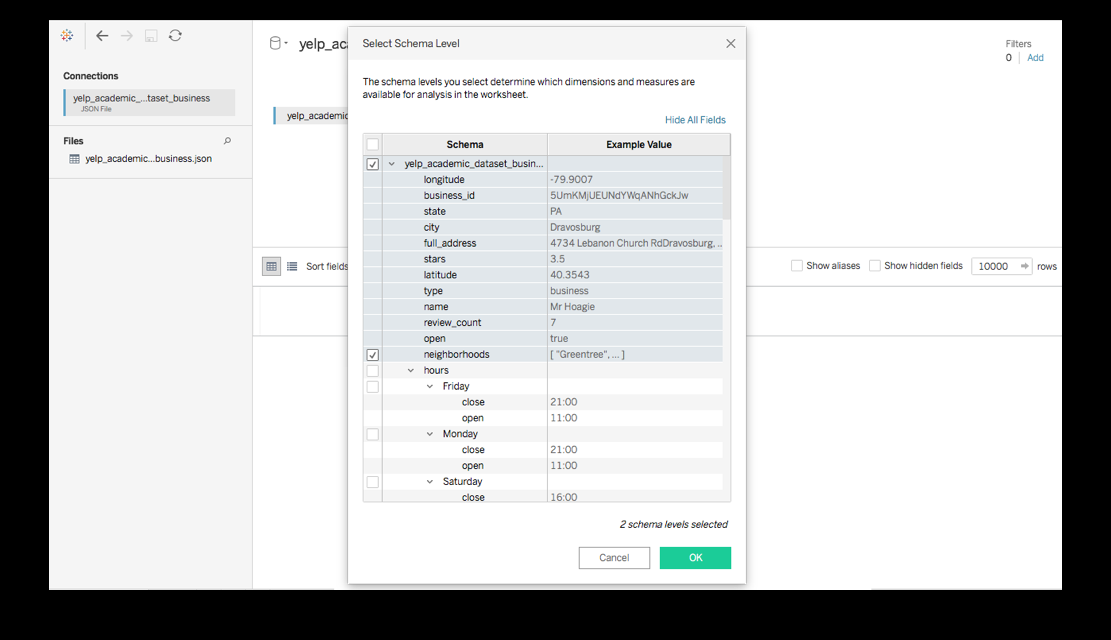
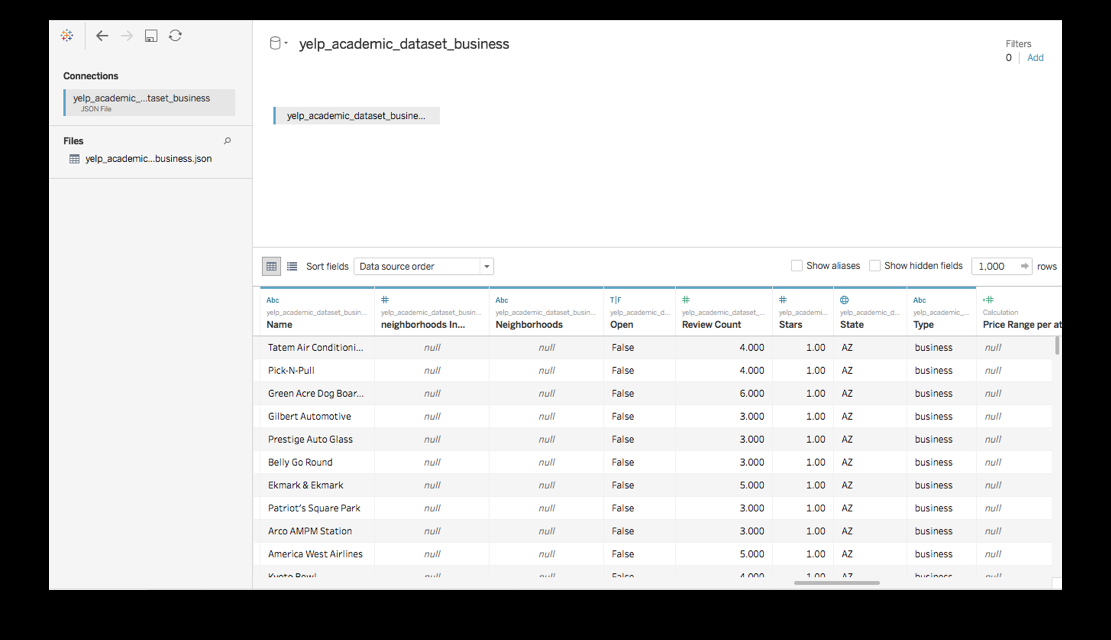
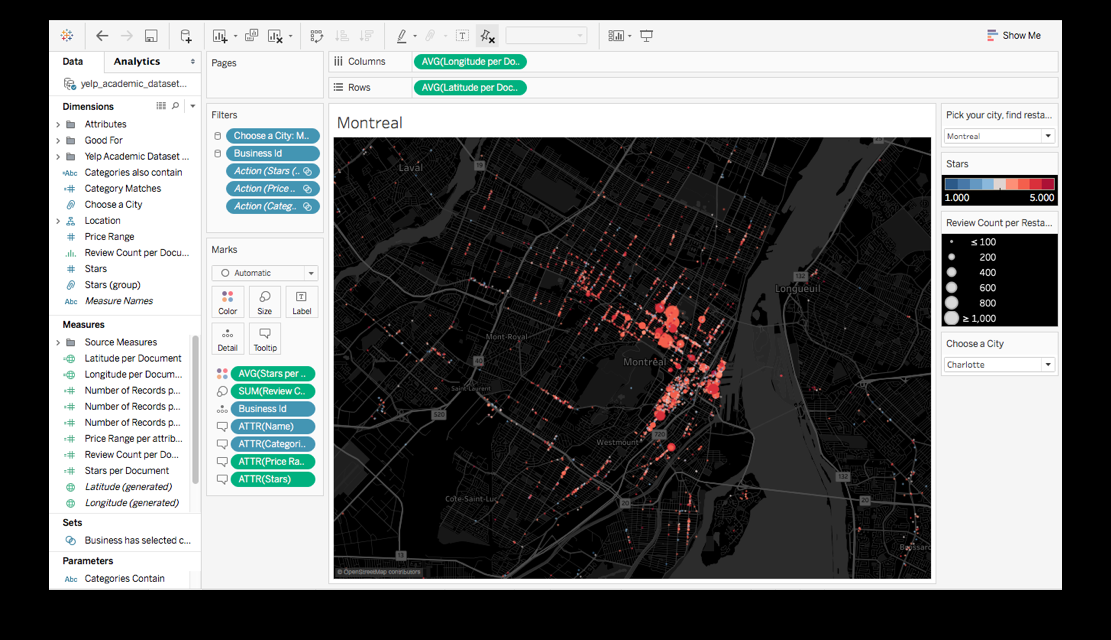
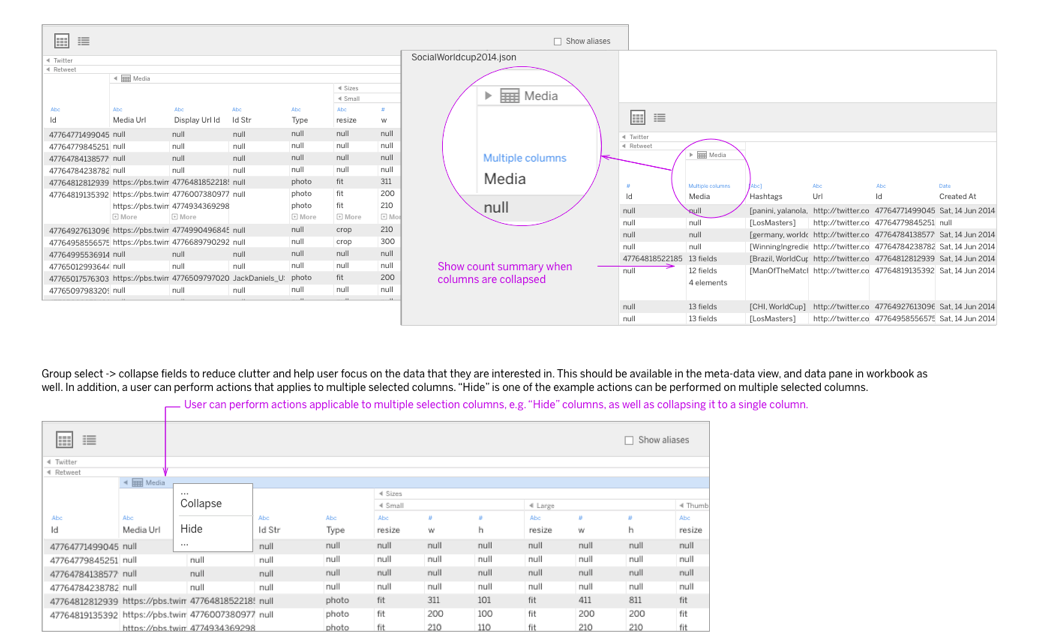
We delivered a JSON connector where users can load and analyze the data. Many of the competitors that integrates the JSON data usually require users to clean and transform the data. Tableau does not require any of the process. It infers the schema, show what the data looks like to help them to make a choice, and then drag and drop the fields to analyze their data, just like they would do when they connect to a flat table.